- Form an explicit table listing the causes and their frequency of occurrence as a percentage
- Arrange the rows in decreasing order of importance of the causes (i.e., the most important cause first)
- Add a cumulative percentage column to the table, then plot the information
- Plot (#1) a curve with causes on x- and cumulative percentage on y-axis
- Plot (#2) a bar graph with causes on x- and percent frequency on y-axis
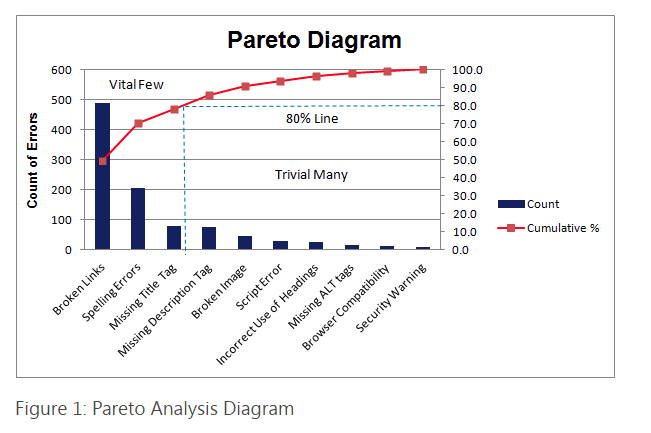
- Draw a horizontal dotted line at 80% from the y-axis to intersect the curve. Then draw a vertical dotted line from the point of intersection to the x-axis. The vertical dotted line separates the important causes (on the left) and trivial causes (on the right)
- Explicitly review the chart to ensure that causes for at least 80% of the problems are captured
en.wikipedia.org/wiki/Pareto_analysis#Steps_to_identify_the_important_causes_using_80/20_rule